Heatbeads
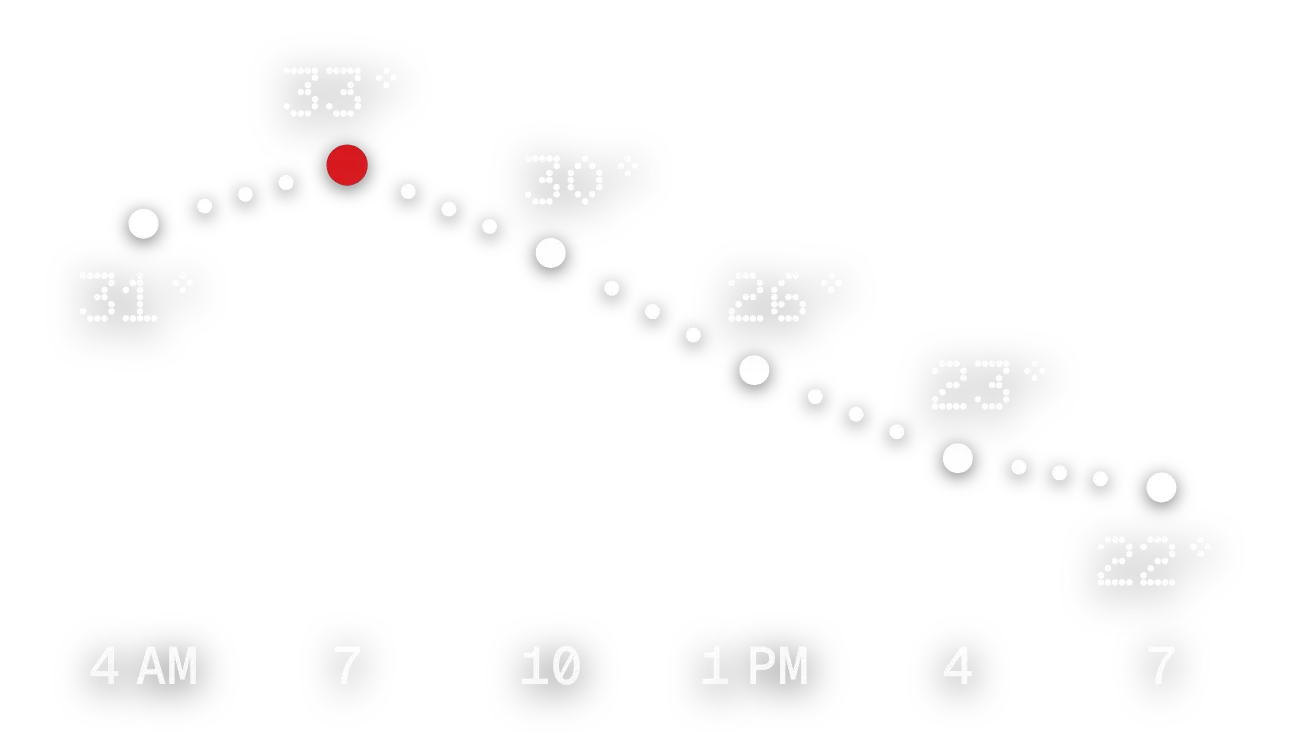
Heatbeads draws the next fifteen hours of temperature as a trail of small white dots running across the home screen with no background panel. Six larger beads mark every third hour, each with a dot-matrix temperature, and the warmest bead is red. Hour labels run along the bottom.
- Size
- 4x2 cells
- Kit
- Nothing
- Shows
- Time and date, Weather
- Look
- Dot matrix, minimal and typographic
- Colours
- White and grey
- Looks like
- Nothing widgets
- Good for
- Daily planning, commuting and choosing clothes
- Android
- 10 or newer
- Needs
- No additional permissions
- Price
- Free
Kiwi is in beta and is not on Google Play yet. Join to request an invitation.
- black
- black-and-white
- chart
- digits
- dot-matrix
- dots
- forecast
- hourly
- minimal
- monospace
- nothing
- red
- retro
- temperature
- temperature-chart
- time-of-day
- transparent
- typographic
- weather
- white
What changes
- The trail rises and falls with the forecast: warmer hours sit higher and cooler hours sit lower. The range is stretched to fit, and a very small spread is still drawn across at least six degrees.
- The six beads start at the current hour and step three hours at a time. The hour labels below them are updated to match.
- The bead for the warmest of the six hours is larger and red. If several hours share the highest temperature, each of them is red.
- Each temperature number sits above a peak, below a dip, and to the side on a rising or falling stretch, so it stays clear of the trail.
- Tapping the widget refreshes the forecast.
- With no city chosen, it shows three dots and the line Pick a city in Kiwi. While loading, it shows Fetching the forecast with the city name. If the forecast fails, it shows Forecast unavailable and Tap to try again.
Data and settings
- Reads the hourly temperature forecast for your chosen city: the current hour, then every third hour for fifteen hours.
- Reads the time to label the hours, in 12-hour form with AM or PM or in 24-hour form to match the time format.
- City: the place whose forecast is charted.
Set it up
- Open Heatbeads in Kiwi, from its kit or from this page.
- Tap Use.
- Confirm your launcher's prompt to place it.
- If the widget shows Pick a city in Kiwi, choose a city so the forecast can be charted.
Good to know
- It needs an internet connection to fetch the forecast, and shows a message instead of the chart when the forecast can't be loaded.
- It needs a city to be chosen before it can chart anything.
- The chart covers only the next fifteen hours, in three-hour steps, so it doesn't show individual hours in between.
- The dots and numbers are white and sit directly on your wallpaper, so they read best on darker or mid-tone backgrounds.
Widgets like Heatbeads
 Hot SpotInstruments
 WindsleeveInstruments
 ThunderheadScenes