Screen Time Large
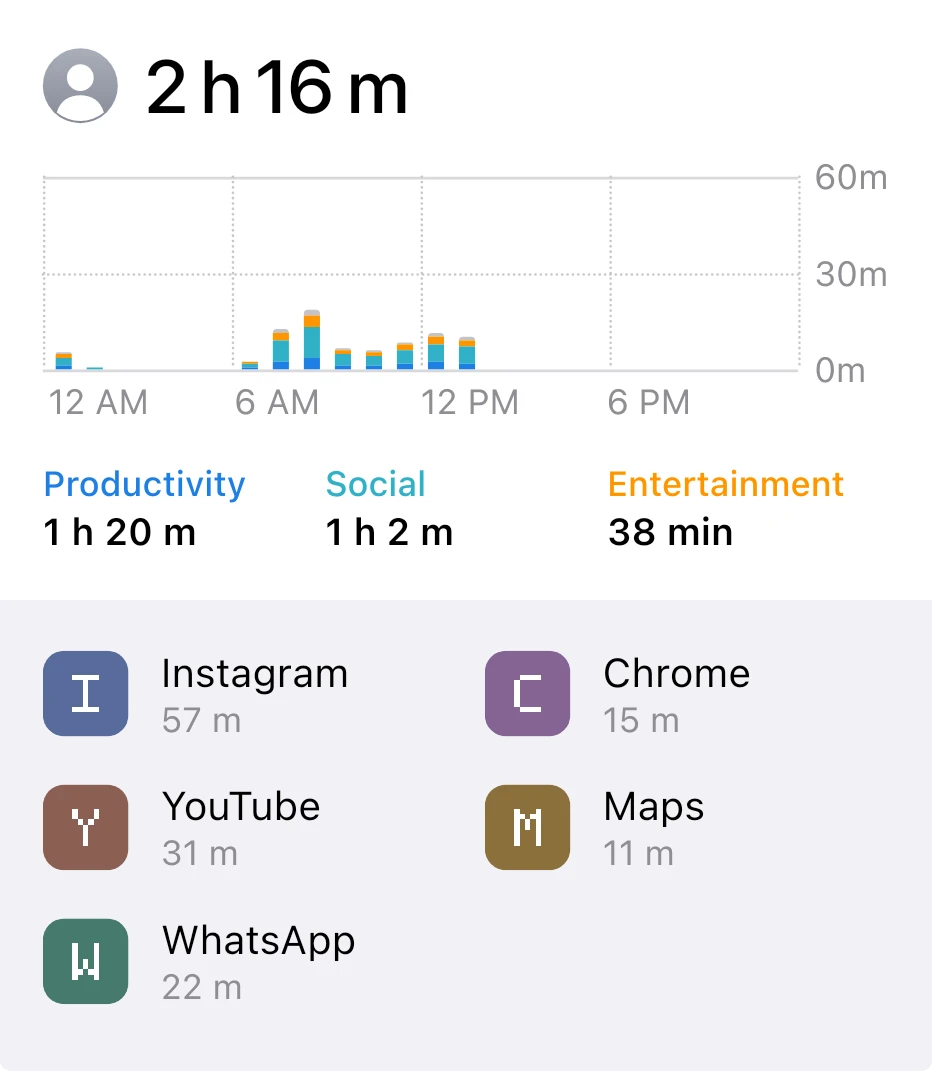
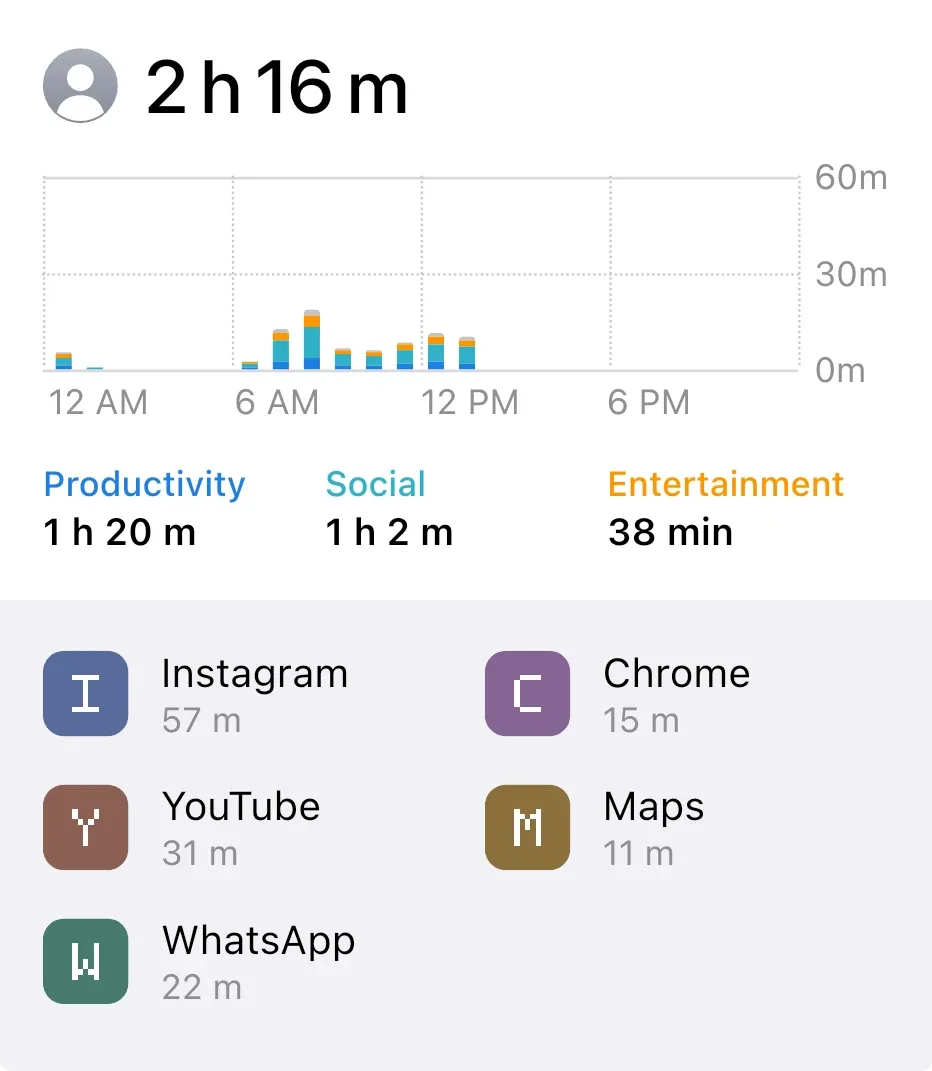
Screen Time Large shows today's total screen time in large type beside a grey profile icon. Below it is an hour-by-hour bar chart on a white background, then three category totals, then a grey panel listing the apps you used most, each with its icon and time.
- Size
- 4x4 cells
- Kit
- iOS & macOS
- Shows
- Screen time
- Look
- Minimal and monochrome
- Colours
- White, light background
- Looks like
- iPhone widgets
- Good for
- Focus and detox
- Android
- 10 or newer
- Needs
- No additional permissions
- Price
- Free
Kiwi is in beta and is not on Google Play yet. Join to request an invitation.
- ios
- screen-time
What changes
- The total at the top is today's screen time, written as hours and minutes, for example 3 h 12 m.
- Each bar in the chart is one hour of the day, scaled against a 0 to 60 minute axis, with time labels along the bottom every six hours.
- Bars are stacked by category: blue for productivity, teal for social, orange for entertainment and grey for everything else.
- Three category names appear under the chart in matching colours, each with the time spent in it.
- The panel at the bottom lists up to six apps in two columns of three, each with its icon, name and time. Tapping an app opens it. If none have been used yet today, it reads No apps used yet today.
- Without usage access, the total is replaced by Usage access is off. A message explains what to allow, and tapping it opens Kiwi.
Data and settings
- Reads your device's screen time for today: the total, the hourly breakdown, the category totals and the per-app times.
- There is nothing to set. The widget shows today's figures as they are.
Set it up
- Open the widget in Kiwi, either from its kit or from this page.
- Tap Use.
- Confirm your launcher's prompt to place it on the home screen.
Good to know
- It can only show screen time once usage access has been allowed in Kiwi. Until then it shows a message and no figures.
- It lists at most six apps and three categories, so other apps and categories are not shown.
- The chart covers today only, so earlier days are not shown.
- The chart axis stops at 60 minutes, which is the most one hour can hold.
Widgets like Screen Time Large
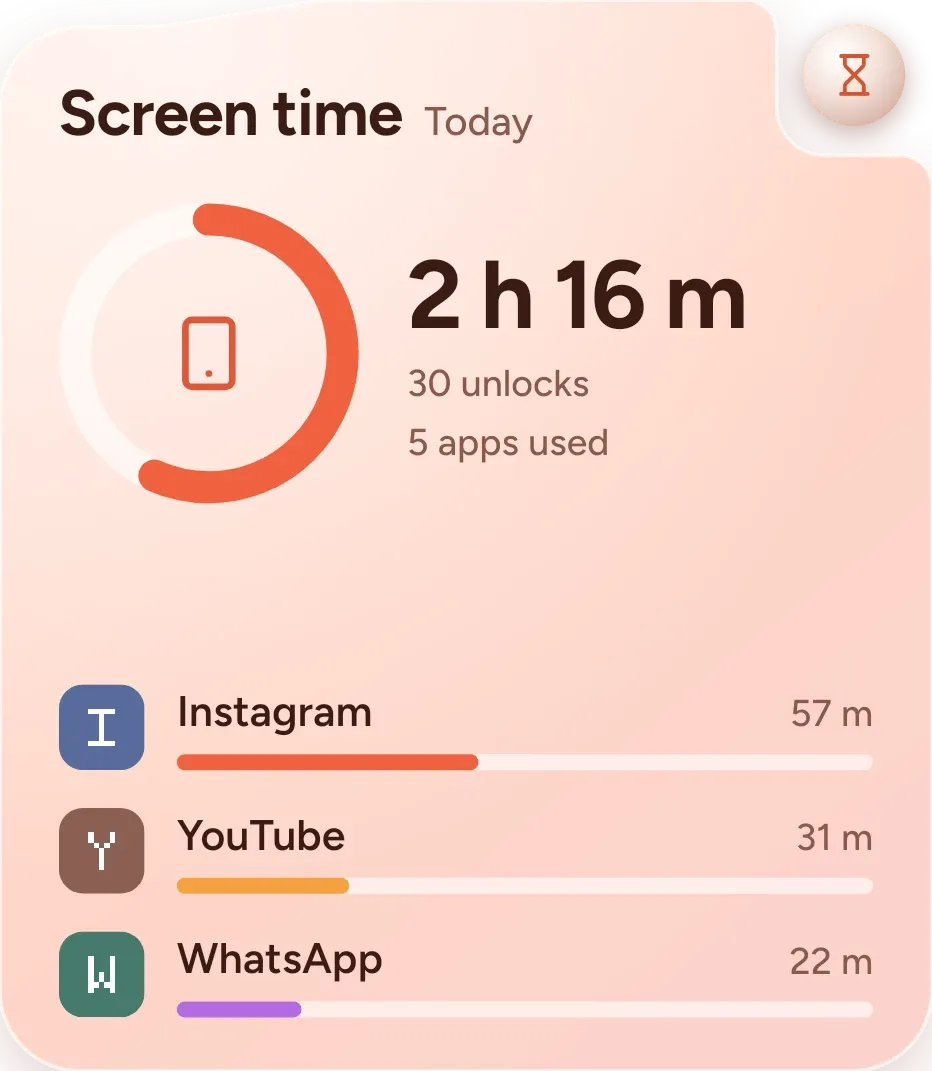 Coral Screen TimeOne UI
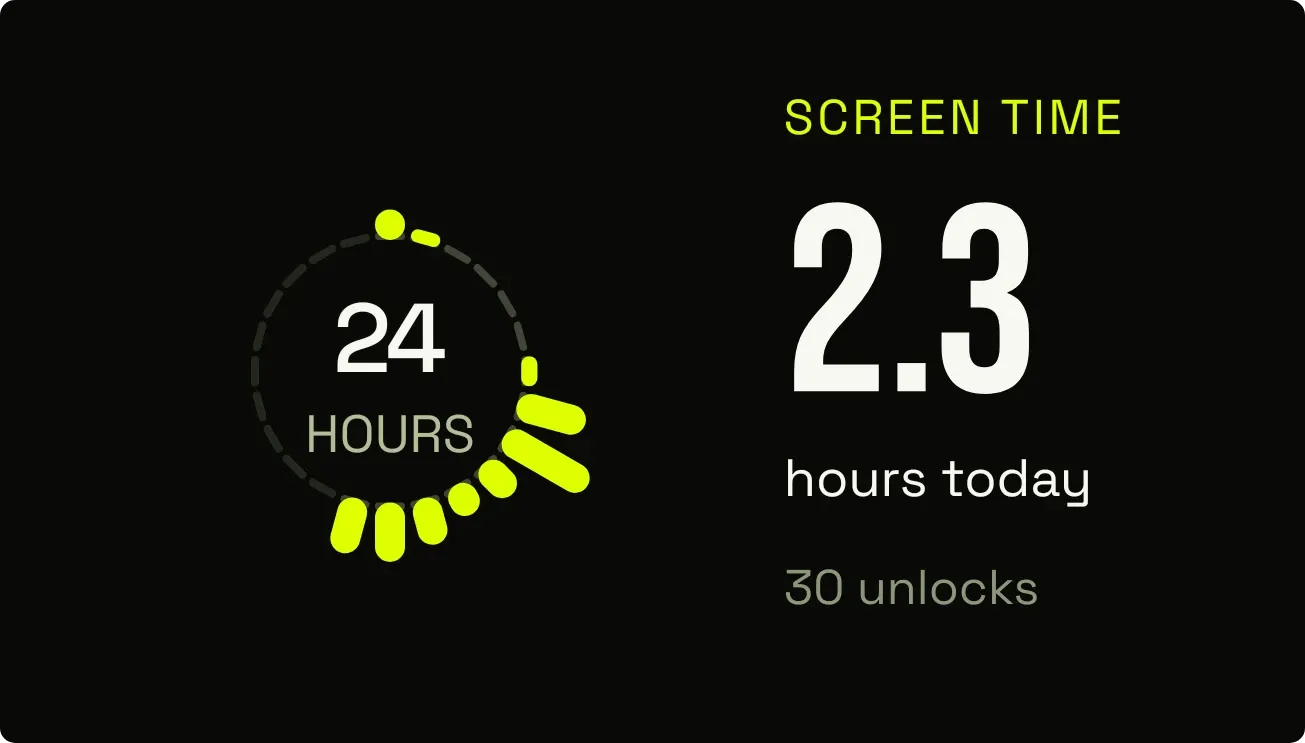 Hour BloomInstruments
 DaydrainMaterial Expressive
 HatchmarkMaterial You